Product-Item, Economic Complexity, Country Competitiveness, Hidalgo
Below we create a model that represents a country's economy based on the products it produces, and the complexity of those products. "Complexity" of both the country and products it produces will essentially be based on the number of different product types, but the chicken-egg aspect of the deeper model will be teased out of the product export raw data using the method below.
Model
The complexity of an economy is proportional to the average complexity of its products, and, vice versa, the complexity of a product is proportional to the average complexity of its producers.
We could say $m_{ij}=1$ if country $i$ makes product $j$ , and $m_{ij}=0$, otherwise, but we need a preprocessing stage first. Let's say $X_{ij}$ is exports (in dollar amounts) of product $j$ of country $i$. The Revealed Comparative Advantage of that country $i$ is
$$ RCA_{ij} = \frac{X_{ij}}{\sum_i X_{ij}} / \frac{\sum_j X_{ij}}{\sum_{i,j} X_{i,j}} $$
Then if $RCA_{ij} > 1.0$ we set $m_{ij}=1$, 0 otherwise.
The weights are $v_{ij} = m_{ij} / d_i$, $w_{ij}=m_{ij}/u_j$ where the diversification of country $i$ and the ubiquity of product $j$ are simply $d_i = \sum_j m_{ij}$, $u_j = \sum_i m_{ij}$. So if $c_i$ is the complexity of country $i$ and $p_j$ is the complexity of product $j$
$$ c_i = \alpha \sum_j v_{ij}p_j $$
$$ p_j = \beta \sum_i w_{ij} c_i $$
where $\alpha,\beta>0$. We see the chicken-egg problem here. We collect variables inside matrices $c$, $p$, $V=[v_{ij}]$ and $W=[w_{ij}]$, then $c = \alpha V p$ and $p = \beta W c$. If we subtitute second the latter in the former, $c = \alpha \beta (V^T W) c$, or the former in the latter, $p = \alpha \beta (V W^T) p$. This means the complexities of countries and products are given by an eigenvector of $V^T W$ and $V W^T$ respectively.
Code
Looking only at 2014 trade data.
import pandas as pd, zipfile
with zipfile.ZipFile('/tmp/hidalgo.zip', 'r') as z:
      df =  pd.read_csv(z.open('hidalgo.csv'),sep='\t')
      gdp =  pd.read_csv(z.open('gdp1416.csv'),sep=',',index_col=0)
      hs =  pd.read_csv(z.open('hs.csv'),sep='|')
      hs2 =  pd.read_csv(z.open('hs2.csv'),sep=',',index_col='ProductCode_x')

pd.set_option('display.max_columns', None)
print (len(df))
print (df.tail(10))
726013
        year origin    hs92  export_val  import_val  export_rca  import_rca
726003  2014    ven  961610     39395.0   2026297.0       0.011       0.947
726004  2014    ven  961620         NaN   1084958.0         NaN       2.413
726005  2014    ven  961700     29666.0   1701096.0       0.005       0.495
726006  2014    ven  961800      2066.0    113839.0       0.001       0.074
726007  2014    ven  970110    210867.0    385141.0       0.004       0.014
726008  2014    ven  970190    179993.0    118881.0       0.136       0.155
726009  2014    ven  970200    976805.0         NaN       0.563         NaN
726010  2014    ven  970300    717009.0    277338.0       0.068       0.045
726011  2014    ven  970500     12723.0         NaN       0.004         NaN
726012  2014    ven  970600         NaN      2484.0         NaN       0.000
cp = df.pivot_table('export_val', index='origin', columns='hs92')
print (cp.shape)
print (len(np.unique(df.hs92)), 'products')
(220, 4858)
4858 products
denom = cp.sum(axis=1) / cp.sum().sum()
denom = cp.sum(axis=1) / cp.sum().sum()
cp2 = cp.div(cp.sum(axis=0).T)
cp2 = cp2.div(denom,axis=0)
cp2 = cp2.fillna(0)
cp2[cp2 > 1.0] = 1.0
cp2[cp2 != 1.0] = 0.0
cp3 = cp2
cp4 = cp3.div(cp3.sum(axis=1),axis=0)
cp5 = cp3.div(cp3.sum(axis=0),axis=1)
print (cp4.shape, cp5.shape)
(220, 4858) (220, 4858)
Country, Product Complexity Method using Eigenanalysis
Country ECI
import scipy.linalg as lin
print (cp4.shape)
uc,vc = lin.eig(np.dot(cp4,cp5.T))
print (vc.shape)
eci = np.array(vc)[:,1]
print (len(eci))
print (np.argmax(eci))
top_countries = cp.index[np.argsort(eci)[:10]]
print (top_countries)
(220, 4858)
(220, 220)
220
181
Index(['jpn', 'che', 'deu', 'kor', 'swe', 'xxb', 'usa', 'sgp', 'cze', 'fin'], dtype='object', name='origin')
Look at simple product sum, is the list the same?
Product PCI
Utilize sparsity,
import scipy.sparse.linalg as lin
import scipy.sparse as sps

scp4 = sps.lil_matrix(cp4)
scp5 = sps.lil_matrix(cp5)

A = scp4.T.dot(scp5)
up,vp = lin.eigs(A,k=2)
pci = np.array(vp)[:,1]
hs3 = hs2.reset_index()
hs3.columns = ['code','idx','desc1','desc2']
hs3 = hs3.set_index('code')
top_prods = cp.columns[np.argsort(pci)[:10]]
pd.set_option('expand_frame_repr', False)
top_prods2 = [str(x) for x in list(top_prods)]
#print (hs3.loc[top_prods2])
for x in top_prods2:
   if x in hs3.index:
      print (hs3.loc[x])
idx                                                    884
desc1                                              - Other
desc2    Plants and parts of plants (including seeds an...
Name: 121190, dtype: object
idx                                                   3132
desc1                                             -- Other
desc2    Wood in the rough, whether or not stripped of ...
Name: 440399, dtype: object
idx                                                   3144
desc1           (-1995, 2007-) -- Virola, Imbuia and Balsa
desc2    Wood sawn or chipped lengthwise, sliced or pee...
Name: 440722, dtype: object
idx                                                   3125
desc1    (-1995) Keruing, Ramin, Kapur, Teak, Jongkong,...
desc2    Wood in the rough, whether or not stripped of ...
Name: 440333, dtype: object
idx                                                    852
desc1                                      - Sesamum seeds
desc2    Other oil seeds and oleaginous fruits, whether...
Name: 120740, dtype: object
idx                                                   3008
desc1                                    (-2001) - - Other
desc2    Tanned or crust skins of sheep or lambs, witho...
Name: 410519, dtype: object
idx                         5422
desc1    Copper waste and scrap.
desc2    Copper waste and scrap.
Name: 740400, dtype: object
Simple regression
cindex = [x.upper() for x in cp.index]
ecigdp = pd.DataFrame(eci,index=cindex)
ecigdp = ecigdp.join(gdp)
print (ecigdp.shape)
ecigdp.columns = ['eci', u'gdp2014', u'gdp2016']
ecigdp['prods'] = np.array(cp3.sum(axis=1))
ecigdp = ecigdp.dropna()
print (ecigdp.tail())
import statsmodels.formula.api as smf
results = smf.ols('np.log(gdp2014) ~ eci', data=ecigdp).fit()
print (results.rsquared_adj)
results = smf.ols('np.log(gdp2014) ~ prods', data=ecigdp).fit()
print (results.rsquared_adj)
(220, 3)
          eci      gdp2014      gdp2016  prods
WSM  0.025062  3761.912686  3524.649880  209.0
YEM  0.075479   679.667360  1101.117444  147.0
ZAF  0.008537  7504.295250  7627.851926  742.0
ZMB  0.048409  1622.409958  1620.823290  182.0
ZWE  0.063000   908.829980   932.548383  275.0
0.5550344026397989
0.23070167903402794
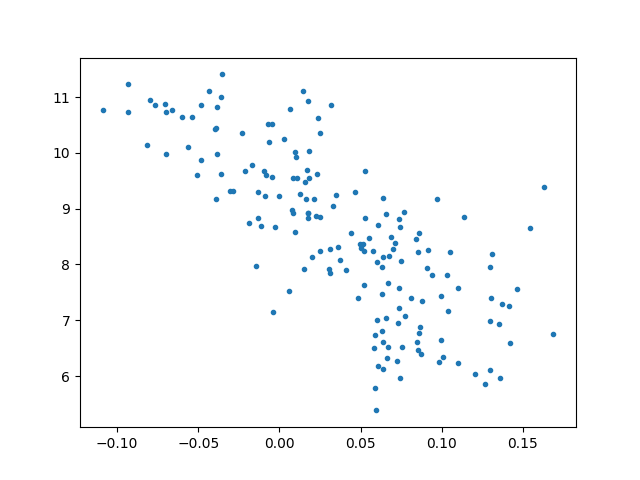
plt.plot(ecigdp.eci,np.log(ecigdp.gdp2014),'.')
plt.savefig('eci_01.png')
References